Earthquakes are common throughout the United States, with the highest activity concentrated in the western states, Alaska, and Hawaii. However, the central and eastern U.S. also experiences occasional damaging seismic events. According to the USGS report, 27 states have experienced potentially damaging earthquakes of magnitude five or greater since 1900. Ten additional states in the central and eastern U.S. have documented significant pre-1900 seismic events. Only 13 states have no record of magnitude 5+ earthquakes, meaning 74% of the country has a history of notable seismic activity—and the potential for future damaging events.
Major Past Earthquake
The following is a list of past major earthquakes within the US territory. You can identify some of the earthquakes on the map shown in the sidebar. However, it is worth noting that the sidebar map does not include earthquake data before 1840. Additionally, there may be minor discrepancies in the magnitudes of some earthquakes reported here and on the map, as they originate from different databases.
- Cascadia subduction zone: M9.0 1700 (offshore Washington, Oregon, California)
- California, Fort Tejon: M7.9 1857
- California, Hayward: M6.8 1868
- California, Owen’s Valley: M7.4 1872
- California, San Francisco: M7.9 1906
- California, Kern County: M7.5 1952
- California, Loma Prieta: M6.0 1989
- California, Landers: M7.3 1992
- California, Northridge: M6.7 1994
- California, Hector Mine: M7.1 1999
- Northern Baja, El Mayor Cucapah: M7.2 2010
- California, Ridgecrest: M7.1 2019
- Alaska, Denali: M7.9 2002
- Alaska-Aleutian Arc: M9.2 1964, M8.7 1965, M8.6 1946/1957, M8.3 1906, M8.2 1938/2021, and M8.0 1949/1985/1986/1995
- Nevada, Pleasant Valley: M6.9 1915
- Nevada, Cedar Mountain: M7.3 1932
- Nevada, Fairview Peak: M7.3 1954
- Nevada, Dixie Valley: M6.9 1954
- Montana, Hebgen Lake: M7.2 1959
- Idaho, Borah Peak: M6.9 1983
- Missouri, New Madrid: M7.3–8.0 1811–1812
- South Carolina, Charleston: M7.0 1886
- Hawaii: M7.9 1868, M7.7 1975, M6.9 2018
- Puerto Rico: M7.7 1943, M6.4 2020
- Near Guam: M7.8 1993
- American Samoa: M8.1 2009
For over 50 years, the U.S. Geological Survey (USGS) has continuously refined the National Seismic Hazard Models (NSHMs) to reflect the latest scientific understanding of earthquake hazards. These models utilize the most up-to-date geologic, geodetic, seismic, and paleoseismic data, as well as the latest modeling methodologies to construct regional probabilistic earthquake hazard maps for the continental US and its territories, including Puerto Rico, Guam, the Mariana Islands, and American Samoa.
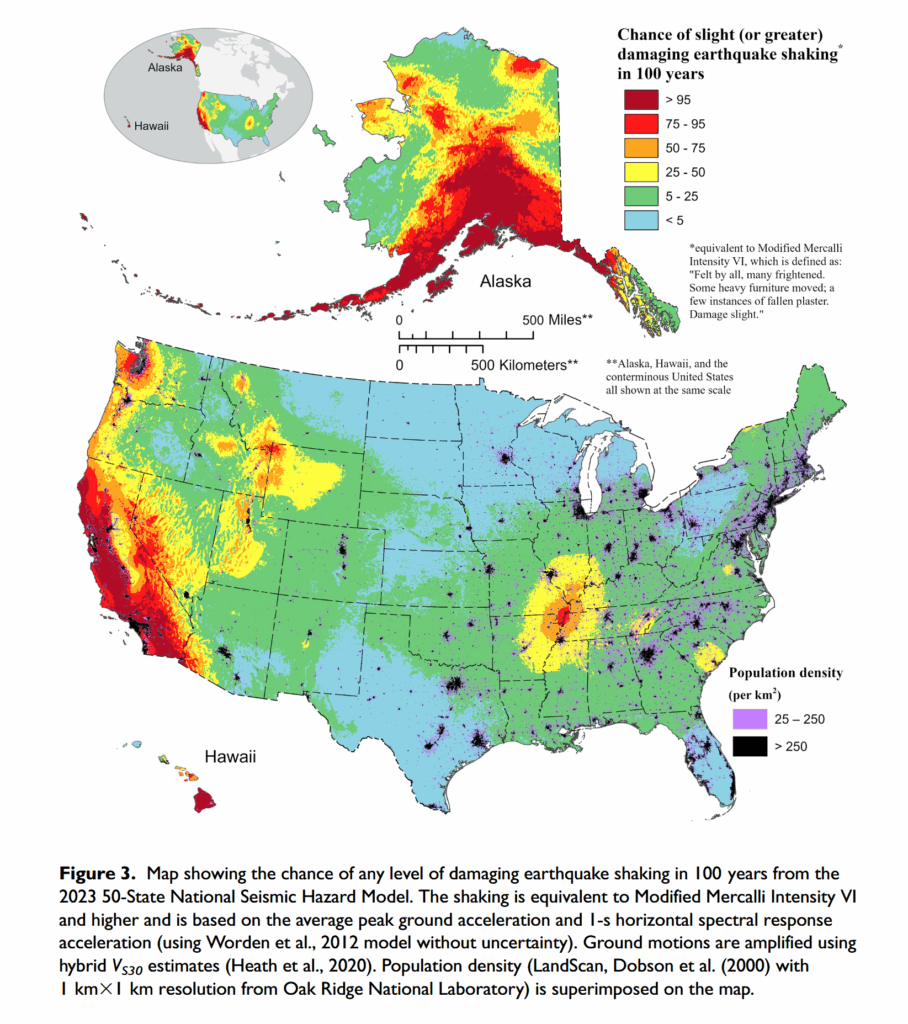
Differences in tectonic settings throughout the region have resulted in varied types and levels of seismicity, as well as distinct fault settings, characteristics, and crustal properties, leading to diverse ground-motion behaviors across different areas. For example, earthquakes in the central and eastern U.S., compared to those in the western states, tend to be felt over larger areas due to the nature of the underlying geology. The figure below shows the most recent, published in 2023, USGS 100-year regional probability estimates for the continental US, Alaska, and Hawaii. The figure is from the USGS National Seismic Hazard Maps article in Earthquake Spectra: DOI: 10.1177/87552930231215428.